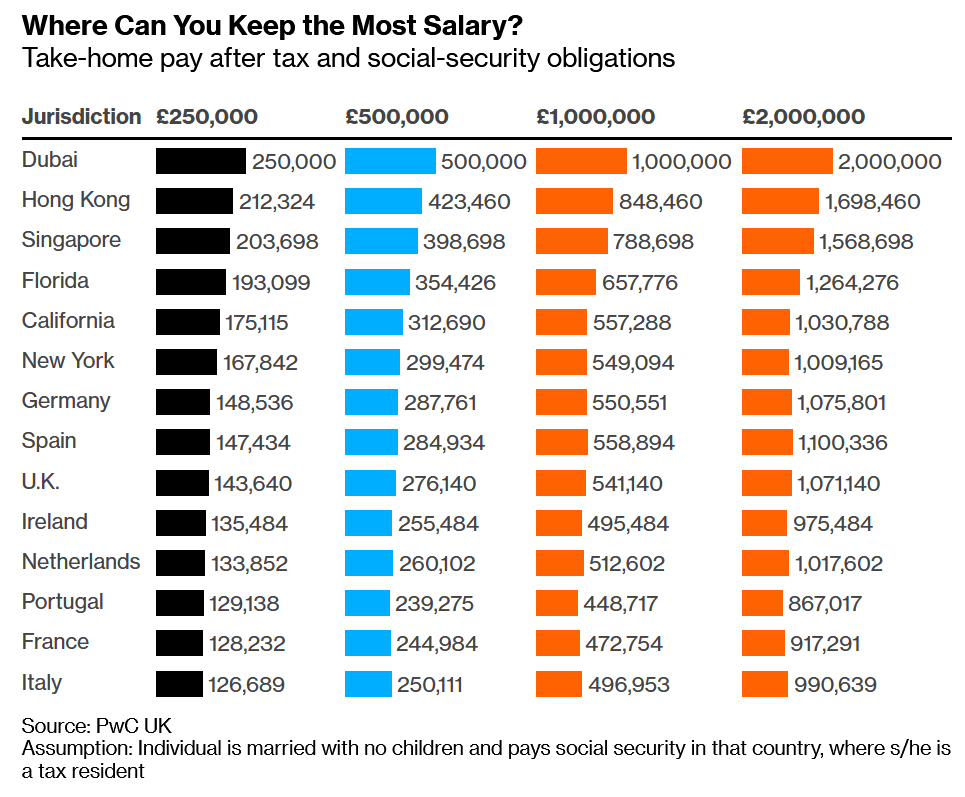
It is often hard to escape the feeling that the grass is greener somewhere else, especially over the last year or so where we have all had very different existences compared to our typical life wherever we are and compared to people we know in other places who may have had more or less harsh restrictions imposed on them. As a result of this there has been a large number of people restructuring their lives. Many expats have returned home to be nearer to their families or to live in a greener location and just as many are relocating away. Some estimates say as many as 30,000 Brits have left the GCC in the last year and a half. So, whilst it is a subjective decision people make, what do the current statistics say about where the best expat destinations to live are?
Data released this month that indexes a variety of factors provides some interesting insights into how life compares in different places. The study looks at pollution levels, commute times, crime levels, health care, purchasing power and property prices relative to incomes. Using this data, they can create an index for the quality of life.
| Country |
Purchasing Power |
Safety |
Health Care |
Cost of Living |
Property Price to Income Ratio |
Commute Time |
Pollution |
Climate |
Quality of life |
| Switzerland |
102.77 |
78.38 |
74.08 |
125.02 |
8.18 |
28.67 |
19.86 |
80.05 |
188.36 |
| Netherlands |
76.65 |
72.84 |
75.28 |
78.93 |
7.28 |
27.64 |
25.39 |
87 |
180.27 |
| Australia |
91.07 |
56.97 |
77.86 |
80.75 |
7.27 |
34.81 |
23.69 |
92.70 |
178.41 |
| Germany |
89.86 |
64.21 |
73.49 |
67.85 |
8.88 |
31.22 |
27.81 |
82.82 |
175.24 |
| New Zealand |
74.89 |
57.12 |
73.59 |
76.31 |
7.78 |
30.72 |
23.72 |
96.69 |
173.60 |
| Oman |
74.87 |
79.66 |
58.42 |
49.64 |
5.45 |
23.02 |
37.21 |
67.22 |
168.82 |
| USA |
94.32 |
52.19 |
69.11 |
70.55 |
4.04 |
32.87 |
39.26 |
77.49 |
163.60 |
| Spain |
58.50 |
66.68 |
78.85 |
56.64 |
9.22 |
29.28 |
39.73 |
93.65 |
163.48 |
| Portugal |
40.54 |
70.09 |
71.85 |
50.65 |
12.92 |
29.33 |
30.19 |
97.81 |
159.83 |
| Canada |
78.34 |
58.11 |
71.69 |
71.45 |
7.24 |
33.69 |
28.54 |
55.29 |
157.25 |
| UK |
77.47 |
53.93 |
75.11 |
70.64 |
9.46 |
34.40 |
40.10 |
88.21 |
156.94 |
| UAE |
84.93 |
84.77 |
68.22 |
58.94 |
4.49 |
36.23 |
49.93 |
45.23 |
156.94 |
| France |
76.36 |
48.01 |
80.56 |
77.59 |
10.04 |
34.79 |
42.17 |
90.41 |
153.60 |
| Qatar |
84.85 |
87.87 |
73.19 |
61.93 |
6.13 |
30.45 |
60.19 |
36.03 |
151.48 |
| Singapore |
78.53 |
72.04 |
71.23 |
82.63 |
17.63 |
41.23 |
33.14 |
57.47 |
146.48 |
| Italy |
54.30 |
55.15 |
66.99 |
69.99 |
8.76 |
34.04 |
54.06 |
91.48 |
137.77 |
| Hong Kong |
56.86 |
78.00 |
66.37 |
80.82 |
45.71 |
42.76 |
67.38 |
83.64 |
96.10 |